
Rental Ladder Rounding

Real estate investors often round up rents to the nearest hundred for analysis. Such rounding can lead to catastrophic errors in real estate investment analysis.
This article suggests using Rental Ladder Rounding. It preserves the accuracy of the analysis. Case studies on the use of ladder rounding are discussed.
Difficulty: medium. 10 min read.
Table of Contents
The tradition of rounding rents
Investors prefer to use rounded rents for analysis. They post thousands of real estate analyses made with the rental calculator on BiggerPockets.
Real estate analyses contain an abnormally high number of rounded rents:
- If the rent is less than $1,000, investors round it up to the nearest $25 or $50
- If the rent is more than $1,000, investors round it up to the nearest hundreds of dollars.
Top of the last two digits of the rents are:
- "...00", 61%
- "...50", 15%
- "...25", 8%
Collectively, rounded rents are used in 84% of rental analysis.
Origin of the rounding tradition
The first time you read this article, you may want to skip this section:
Origin of the rounding tradition
Rents for real estate analysis are calculated as the average between the rents of five or more neighboring similar homes. Average rents are calculated to the nearest dollar; they look like $1017, $1069,…
But investors believe the exact rental values are far from the landlord's practice. They traditionally list rents in the rental agreement that are rounded to the nearest $50 or $100. Investors transfer their experience with rental agreement drafting to a rental property analysis. Most investors additionally round up the exact value of the averaged fee, as they are accustomed to doing for a rental agreement, before beginning their analysis. They don't realize that:
- Yes, it' fine to round up rents before negotiating with tenants. People are more comfortable dealing with rounded values
- But they have to use as accurate an average rent as possible for the analysis. After all, a computer or calculator works with numbers of any accuracy without the smallest difficulty.
The tradition of rounding rents is spreading through investor forums. Newbies see that most published real estate analyses rely on rounded rents, and start rounding up, too. When the next newbie tries to use the exact average rent in their analysis, experienced investors teach them to start their real estate analysis by rounding the rent to the nearest $50 or $100. As a result, rounded rents are the most common thing in investment property analysis.
The effect of rental rounding
Image via MakeaMeme.org
Rounding average rents can destroy the entire analysis of an investment property.
For example, an investor must make a decision to buy an investment property. The analysis indicates:
- Rental value — $1,100, annual rental growth — 2%
- Monthly expenses — $550, annual growth of expenses — 3%
- Analyzed period — 30 years
Evidently, the average rent of $1,100 per month is a rounded value and that the exact value of the rent is in the interval between $1,050 and $1,150. Over the years, the interval of possible rental values will increase.
Chart 1, Rent by year:
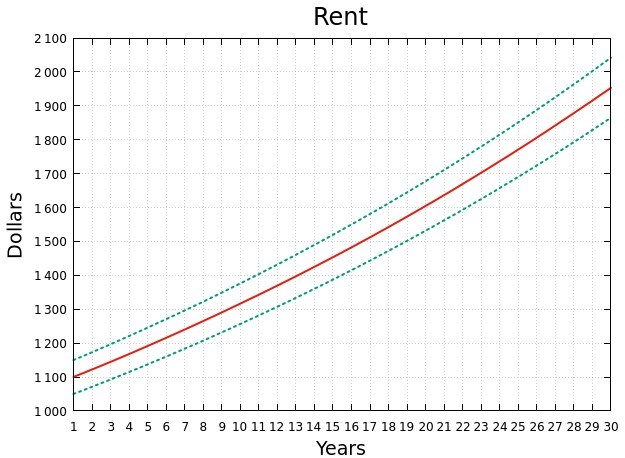
Explanation: The green lines show the limits of the rent interval by year. Actual rents are between the green graphs. The red line shows rental growth that starts from the rounded value. The red line is just one of many possible rent increases.
But investors are more interested in Net Operating Income (NOI). The interval of Monthly NOI will increase from $100 in the first year to $177 by the 30th year:
Chart 2, Monthly Net Operating Income by Year:
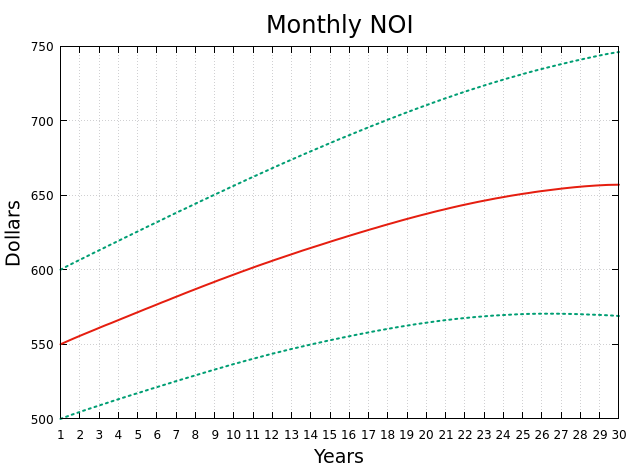
Explanation: The green lines show the limits of the NOI by year. Actual NOI is between the green graphs. The red line is the NOI received from the rounded rent. The red line is just one of many possible NOI increases.
Now let's calculate the total NOI accumulated to each year in the 30-year period.
Chart 3, Total Net Income by Year:
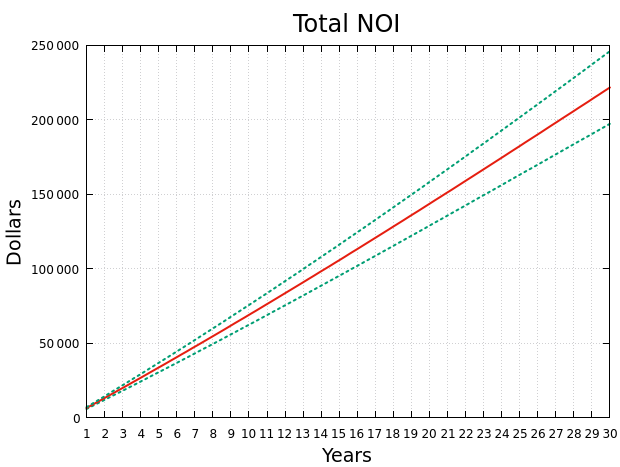
Explanation: The green lines show the limits of the total NOI by year. Actual total NOI is between the green graphs. The red line is the total NOI received from the rounded rent value. The red line is just one of many possible total NOI increases.
By the end of the analysis period, the interval of possible Total NOI in the past years will be between $197160 (if calculated from $1050 starting rent) and $245832 (if calculated from $1150 starting rent). In the interval of possible values, the upper value of Total NOI exceeds the lower value by 25% (24.7%)!
The traditional rounding of monthly rent to the nearest hundred dollars has had destructive effects in our example. Analysis of the investment appeal of real estate has become inaccurate:
- Net Operating Income for the full period of analysis received a spread (inaccuracy) of 25%
- A similar inaccuracy of 25% was obtained by all ratios, which are based on NOI (ROI,…)
The investor risks making the wrong decision depending on where the real value of the rent inside the interval happens to be:
- Or he can invest in real estate that isn't suitable for investment
- Or he can refuse to invest in real estate that is suitable for investment.
Rental Ladder Rounding
There are two requirements for REI analysis:
- We need to be careful about the expectations of investor-buyers to see rounded rents in REI analysis. They are the consumers of REI analysis. "Customer is King".
- On the other hand, we have an obligation to accurately calculate Total NOI for our kings, the investor-buyers. "Accuracy - the politeness of kings and the duty of their subjects."
These two poorly compatible requirements can be realized through ladder rounding.
Consider, for example, an exact average rent of $1,050 and an annual rent increase of 2%.
Let's compare the 3 formulas for calculating rent.
Formula 1. Investor Rounding. Round up the rent to $1,100 and feed it into the exact formula input:
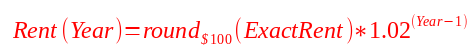
Where “round” is rounded to the nearest hundred dollars.
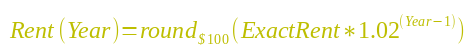
Formula 2. Ladder Rounding. We take as a basis the exact formula. Its result rounded up each year to the nearest $100:

Where “round” is rounded to the nearest hundred dollars.
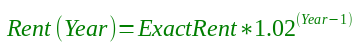
Formula 3. No Rounding, Exact Rent. The annual rental rate is calculated from the exact rent of $1,050:

Table "Rent by Year, in dollars:
| Years | Investor Rounding | Ladder Rounding | No Rounding, Exact Rent |
| 1 | 1100 | 1100 | 1050 |
| 2 | 1122 | 1100 | 1071 |
| 3 | 1144 | 1100 | 1092 |
| 4 | 1167 | 1100 | 1114 |
| 5 | 1191 | 1100 | 1137 |
| 6 | 1214 | 1200 | 1159 |
| 7 | 1239 | 1200 | 1182 |
| ... | ... | ... | ... |
| 28 | 1878 | 1800 | 1792 |
| 29 | 1915 | 1800 | 1828 |
| 30 | 1953 | 1900 | 1865 |
Ladder Rounding has 3 benefits over traditional one-time rounding of starting rent.
Benefit 1. The yellow column with Ladder Rounding looks familiar to investors who are used to charging rounded to the nearest hundred dollars.
Benefit 2. In any year, the yellow column with Ladder Rounding deviates from the exact green chart by no more than $50.
Chart 4:
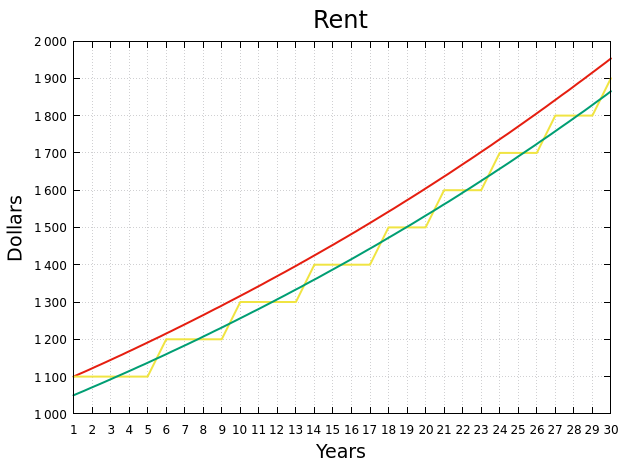
Explanation: The yellow chart of the ladder rounding looks like a ladder. It is nearly identical to the green graph of the exact rent formula.
Benefit 3. Ladder rounding rounds the rent up or down. Ladder rounding variations compensate for each other when we sum the rent by months and years. Therefore, ladder rounding and the exact formula produces nearly identical Total NOI values over the entire analysis period.
Example:
- The exact rent is $1,050, with 2% annual rent increase
- Monthly expenses - $525, with 2% annual growth of expenses
- The analysis period is 30 years
See percentage variation of Total NOI with different rounding methods.
Table: percentage variation of Total NOI by year:
| Years | Investor Rounding | Ladder Rounding | No Rounding, Exact Rent |
| 1 | 9.52 | 9.52 | 0 |
| 2 | 9.57 | 7.49 | 0 |
| 3 | 9.62 | 3.43 | 0 |
| 4 | 9.71 | 1.34 | 0 |
| ... | ... | ... | ... |
| 27 | 11.24 | 1.21 | 0 |
| 28 | 11.34 | 1.21 | 0 |
| 29 | 11.43 | 1.00 | 0 |
| 30 | 11.52 | 1.16 | 0 |
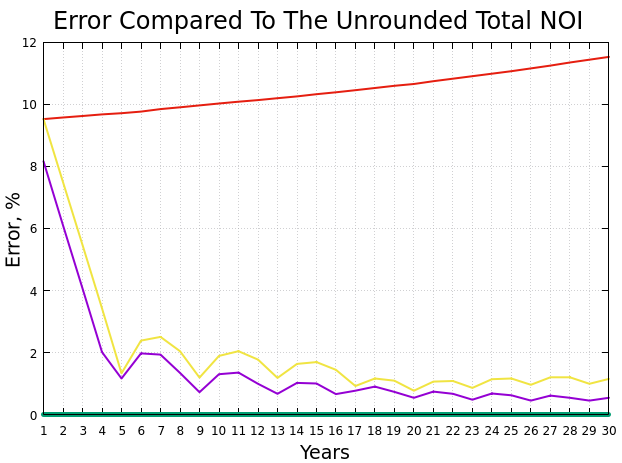
Chart 5:
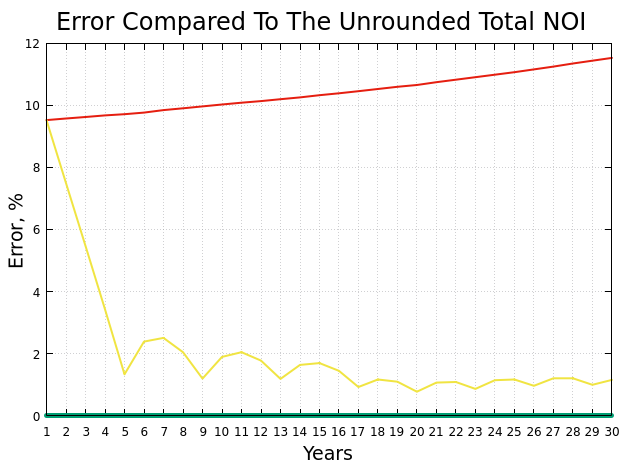
Explanation:
- Investor Rounding (red chart) has a starting error of 9.5% in determining Total NOI. This error increases over the years.
- Ladder Rounding (yellow chart) has the same 9.5% error in determining Total NOI at the start. But Ladder Rounding quickly reduces the error in the first years of analysis. Starting in year 5, the error in the Total NOI determination with Ladder Rounding is only about 2%. From year 17 onwards, the error in the Total NOI determination with Ladder Rounding decreases to 1%. This is acceptable for practical purposes. (Total NOI is compared to the ARV, which is determined by a few percent accuracy).
Monthly ladder rounding
Real estate analysis gourmets can use an even more advanced ladder rounding formula.
You can skip this subsection the first time you read the article.
Monthly ladder rounding
The tradition of changing rents once a year in the analysis goes back to the old days when abacus or calculators were used. Nowadays, real estate analysis uses computers. There are no technical obstacles to doing the analysis on a monthly basis.
Monthly Ladder Rounding Formula:
In this advanced formula, we round up the monthly rent not once a year, but every month:
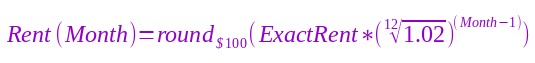
Over the entire analysis period, the advanced ladder formula (purple chart) deviates only 0.5% of the exact Total Net Operating Income.
Chart 6:
Monthly ladder rounding agrees well with the practice of changing rents. The rent does not change once every 12 months. The landlord waits until the average market rent approaches the next rounded value. At that point, he changes the rent. This event can occur in any month of the year.
Comparison of rounding options
The one-time rounding at the start (red chart) isn't useful for real estate investments. It introduces too much bias into Total Net Operating Income, regardless of the term of the analysis.
If the investor-buyer prefers to invest only for the long term (15-30 years), he can use the annual ladder rounding (yellow chart). It manages to compensate for the large starting deviation over the long term.
If the investor-buyer invests at least occasionally for short terms (5-10 years), it's better to use the monthly ladder rounding (violet chart).
If you're doing the analysis for yourself, use the exact rents without rounding. Then you'll get the 0 % error at any term of the analysis (green chart).
Origins of ladder analysis
Ladder rounding has long been used in quantum physics and in banks.
The first time you read this article, you may want to skip this sections:
Quantum Physics
Physicists use Ladder approximation to analyze quantum fields.
In the 20th century, Bethe and Salpeter proposed an equation that "describes the bound states of a two-body (particles) quantum field theoretical system in a relativistically covariant formalism":
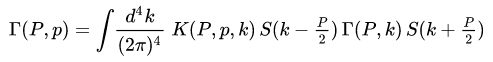
Too hard? Quantum physicists also spent a long time trying to understand how this equation works and how to use it.
But in 1948 American physicist Richard Feynman showed in a diagram that this function looks like a ladder:
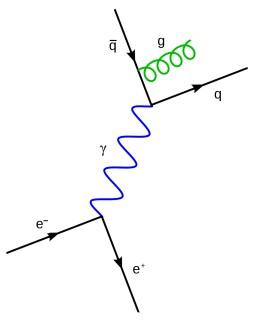
The eyes of physicists had fallen away. They began to create pioneering theories based on Feynman's diagrams and received Nobel Prizes for them.
Bankers' Rounding
In finance, a lot of rules are formulated in percentages - loans, deposits, service fees. You have to do rounding when converting interest into real money. The school rounding rule teaches you to round the last digit 5 up:
0,5 -> 1
- 1.5 -> 2
- 2.5 -> 3
- 3.5 -> 4
But we will have trouble rounding up the sales tax (credit rate, deposit interest,...) with the number 5 on the end. If you round up all the time when converting into real money, it will look unfair to one side of the transaction.
Also, often sum up a lot of rounded numbers. If you round the last digit 5 up, a systematic calculation error will accumulate when adding up.
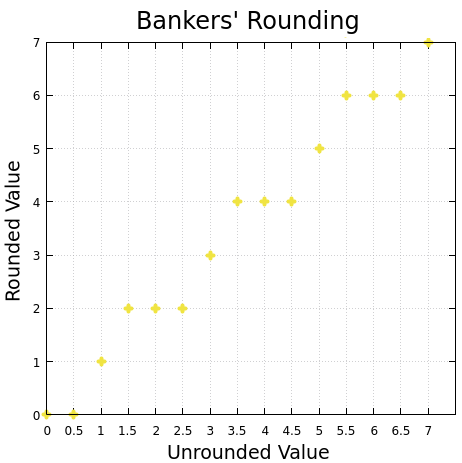
In such cases, the so-called Bankers Rounding is used. The Bankers' Rounding changes 0.5 to the nearest even number:
- 0,5 -> 0
- 1.5 -> 2
- 2.5 -> 2
- 3.5 -> 4
On the graph it looks like a familiar ladder:
Ladder Analysis Cases (Use Cases)
When you first read the article, open only the cases that happen in your investment practice.
1. Use of rental calculators
Online rent calculators and Excel spreadsheets for analysis don't offer Ladder Analysis as an option.
Always give them the exact rent you get from online sources. In 1% of the cases, the exact rent may end up with two zeros on the end. Then write in the analysis notes that this is the exact value. Otherwise, your analysis may be considered rounded and unreliable.
2. Real estate analysis for yourself
Use unrounded input parameter values in your analysis to the nearest dollar. After the analysis is complete, you may round up the output values slightly to make them easier to use.
Do all rounding only after the analysis is complete. After rounding the output parameters, do not use them for further analysis.
3. Preparing analysis for other investors
There is a group of professionals who prepare an analysis for active and passive investor-buyers. They are wholesalers, flippers, mutual funds, accession managers, analysts, … I recommend that they follow two rules in their rent projections:
A) If the recipient of the analysis doesn't mind accurate rent estimates to the nearest dollar, then apply the exact rent growth formula:
B) If the analysis requester prefers to see a rounded value in the analysis, then use a formula with ladder rounding:
It starts with rounded rents and gives rounded rent numbers year by year. In doing so, the total income for all years at the ladder rounding coincides with the exact base rent formula.
Give in the analysis the exact average rent value. Give a table where you round up the rent projection year by year based on the exact value. An investor-buyer with little understanding of the analysis will be satisfied with the table. An experienced investor-buyer will use the exact average to check your calculations. This will be able to verify that the total income based on the table with ladder rounding is very close to the total income from the exact value without any rounding.
4. Performing analysis based on client data
Analysts often have to perform analyses based on data provided by the client or hirer. If the analysis requester gives you a rental value ending in ...00, ...$25, ...$50, or $75, they probably like to round it up.
Then find out the original unrounded value. Do your analysis with ladder rounding. Your analysis will look as if the rent starts with the rounded value and further values year by year will also be rounded. But the ladder rounding will "wiggle" around the exponent from the exact unrounded value and it will keep Total Net Operating Income accurate.
5. Using analysis from a wholesaler/flipper
When you are sold an investment property for rent, the seller will enclose his investment appeal analysis. If the analysis users a rent with an ending of ...00, ...$25, ...$50, or $75, the wholesaler has most likely rounded up the exact rent.
Also check to see if the seller rounded up the numbers under "Expenses" - electricity, gas,...
If you find clear signs of rounding in the original income and exposures numbers, ask the seller to indicate to do a new analysis based on the exact numbers, without rounding.
6. Hiring an REI analyst
Ask a candidate to analyze a rental property. Give an example with a rounded rent value as a test:
- Property value is $105,000
- Rent is $1,100 with an annual increase of 2%
- Expenses are $550 per month with an annual growth rate of 3%
- ...
Perhaps the analyst candidate will not notice that the average rent is rounded and do the analysis. Such a candidate doesn't understand that an analyst must first check the validity of the raw data and not use questionable data before calculating it. If you hire him or her, in the future all the random errors and rounding in your data will be used in the analysis.
But it's also possible that the candidate will notice a rounding in the rent and ask you to give him the exact value of the expected rent. Over and above expectations, if he still does a ladder rounding for the exact rent. That's a good prognosticator:
- The analyst candidate is up to date on the latest innovations in real estate investment analysis
- He (same as you) read this article. 😉
7. Development of rental calculators
Before you start calculating, your calculator has to check the entered rent value. If it's a multiple of $25, $50, or $100, the calculator will prompt the user to enter the exact value (if there is one). If the rounded value is the exact value, the user must confirm this fact.
Make the ladder rounding option of rent in your calculator. After the calculations, the calculator will produce a table of rents by year, calculated using the ladder rounding. 84% of users will enter the exact rent value with peace of mind if they get the usual rounded rent in the analysis results.
Call To Action
Would you like to be notified when the next analysis article is published? Subscribe to our «REI Analysis» newsletter.

